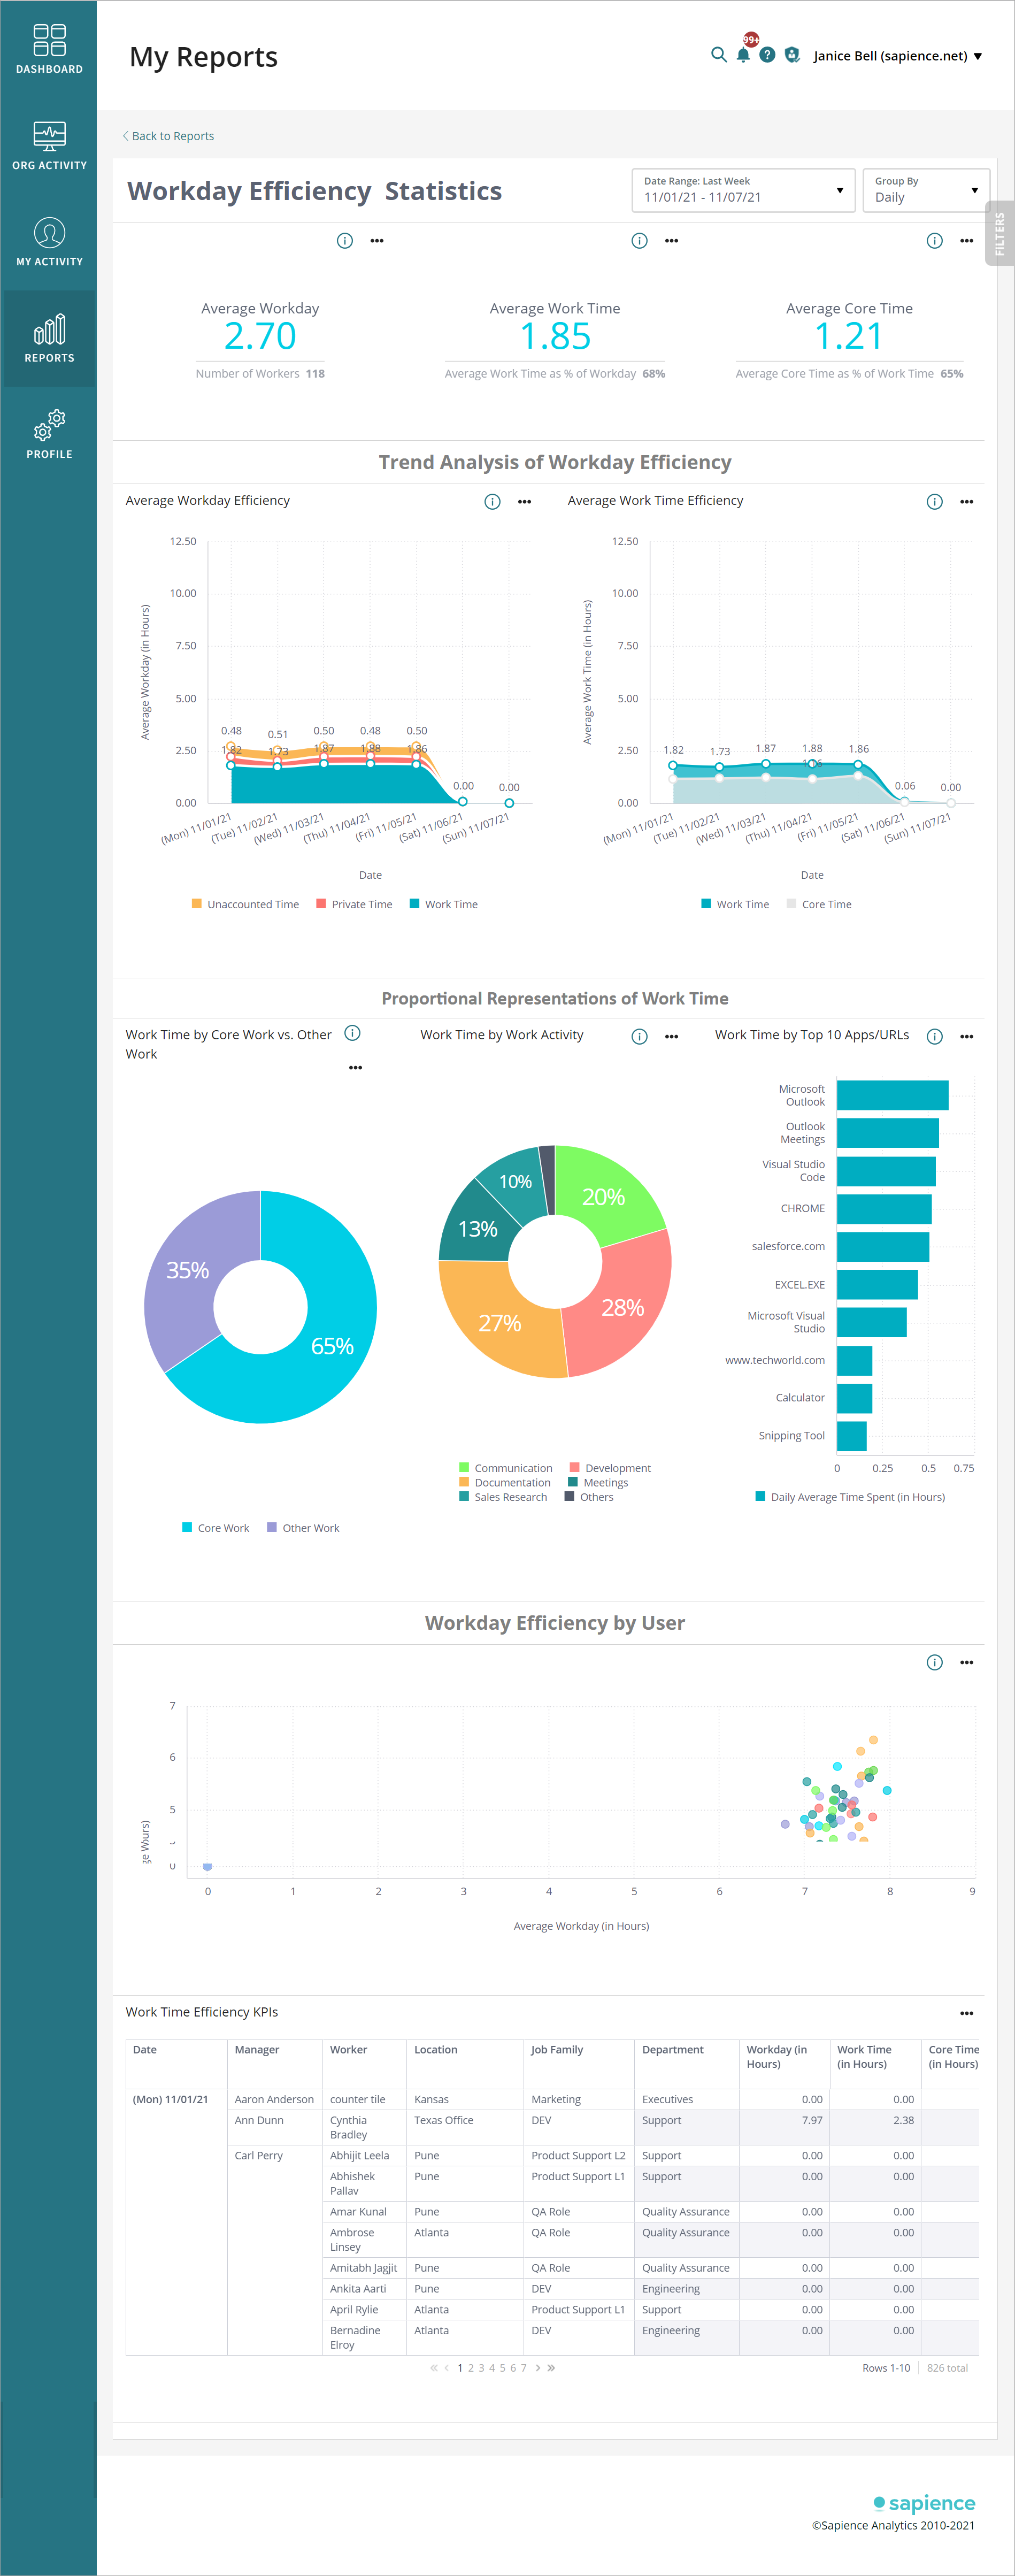
Workday Efficiency Statistics
This report provides a high-level summary of key time spent metrics for Managers and Organization Owners.
Note:
•This report displays data only for Registered Sapience Workers whose Activity Collection is ON.
Available Filters:
•Date Range
•Group By
•Location
•Job Family
•Department
•Manager
•Worker
•Work Type
•Activity
•Applications / URLs
In the report:
•Average Workday (in Hours): Average of Workday for the Number of Users identified by the filter for the selected date range.
Workday time is the time between worker's first activity (online/offline) and the last activity (online/offline) for the day.
Workday Time = Work Time (Online and Offline) + Private Time (Online) + Unaccounted Time
•Average Work Time as % of Workday: Average Work Time % and the actual Work Time for the Users identified by the filter for the selected date range.
•Average Core Time as % of Work Time: Average Core Time % and the actual Core Time for the Users identified by the filter for the selected date range.
•Trend Analysis of Workday Efficiency:
•Average Workday Efficiency: Trend of Average Workday for Unaccounted, Private, and Work Time over the selected date range.
•Average Work Time Efficiency: Trend of Average Work Time for Core, and Work Time over the selected date range.
•Proportional Representations of Work Time:
•Work Time by 'Core' vs. 'Other' Online/Offline Work Time
•Work Time broken down by Work Activity
•Top 10 Work Applications and/or URLs by Time Spent
•Work Day Efficiency by User: Bubble Graph representing the user-wise relationship between Average Work Time and Average Workday for all the users identified by the filter for the selected date range.
•Work Time Efficiency KPIs: Table with user-wise work time-related details.