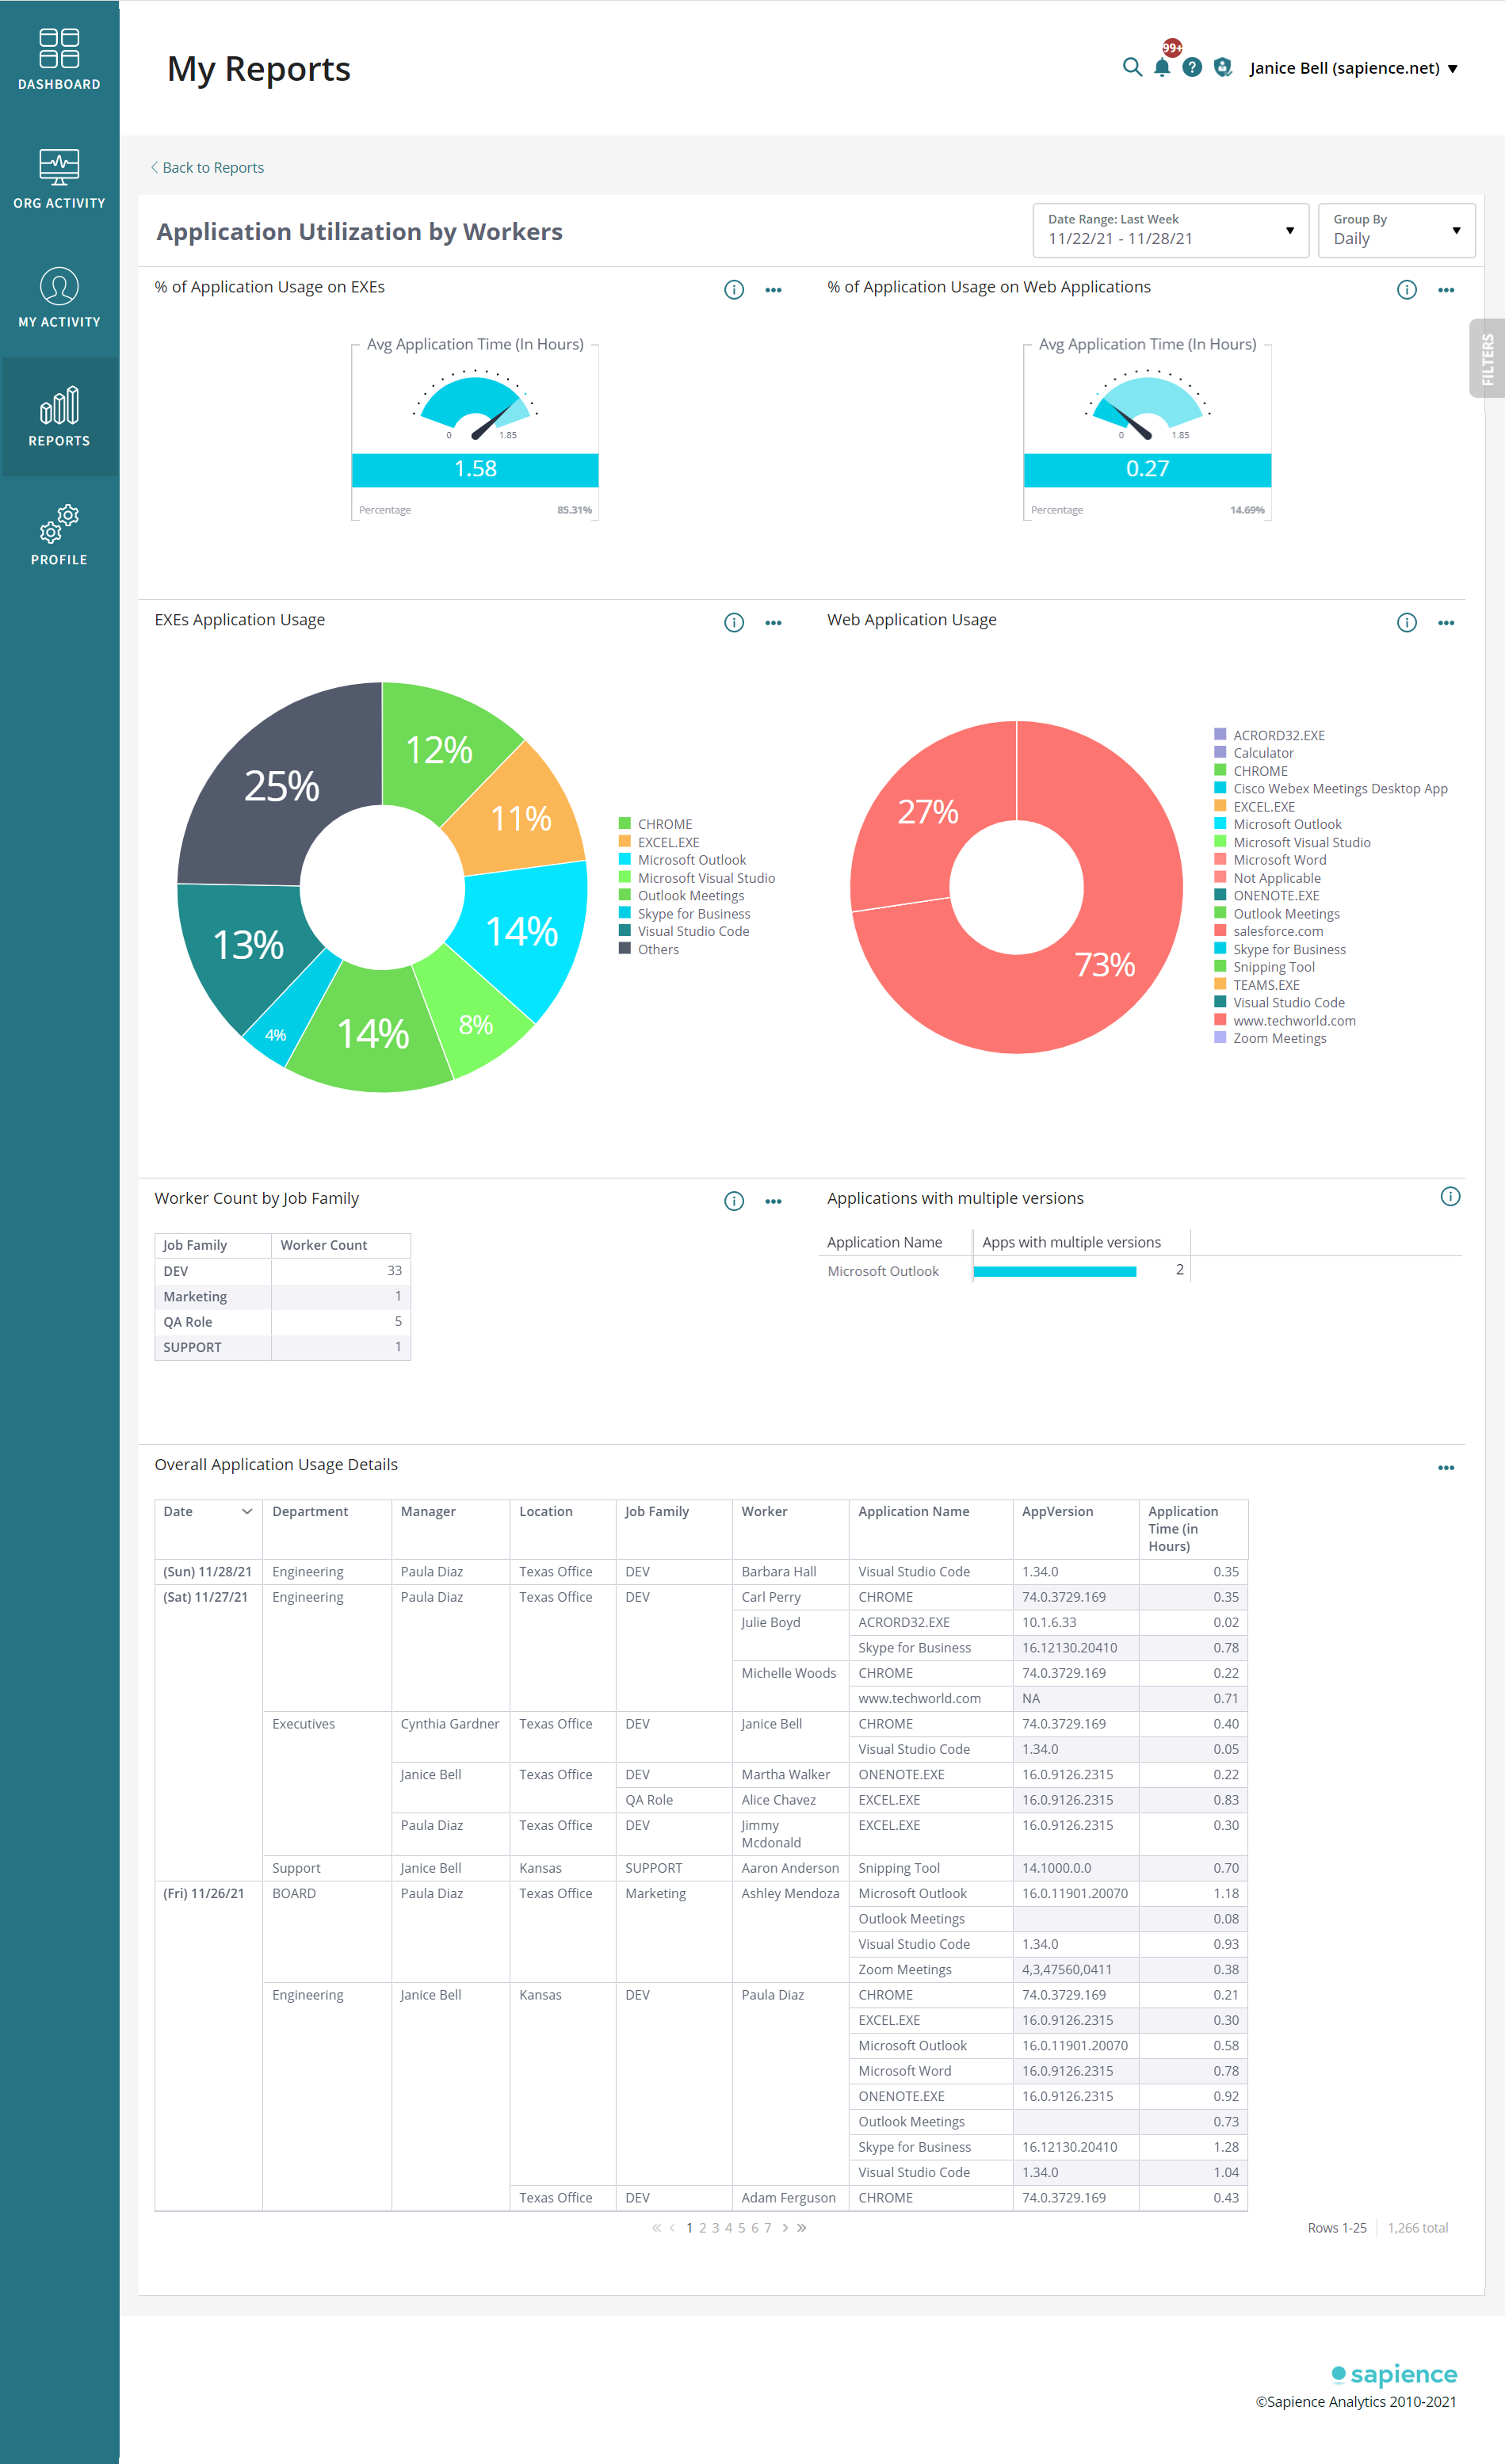
Application Utilization - by Users Report
This report lists the applications utilized along with the duration details.
Note:
•This report displays data only for Registered Sapience Workers whose Activity Collection is ON.
Available Filters:
•Date Range
•Group By
•Department
•Location
•Job Family
•Manager
•Worker
•Categories
•Applications
In the report:
•% of Application Usage on Exes and Web Applications: The chart displays Average Application Time and Percentage against the overall time spent on Application usage by the workers identified by the filter for the selected data range.
•Exes and Web Application Usage: displays the summary of application usage by workers identified by the filter for the selected date range. The pie chart displays the list of Exes/Web applications used, their usage in hours, and the overall percentage with respect to other applications in the list.
•Worker Count by Job Family: Table displays job family-wise count of workers identified by the filter for the selected date range.
•Application with multiple versions: Table displays the list of applications with multiple versions used by the workers identified by the filter for the selected date range.
•Overall Application Usage Details: Table displays the date-wise application name, version and usage for workers identified by the filter for the selected date range.