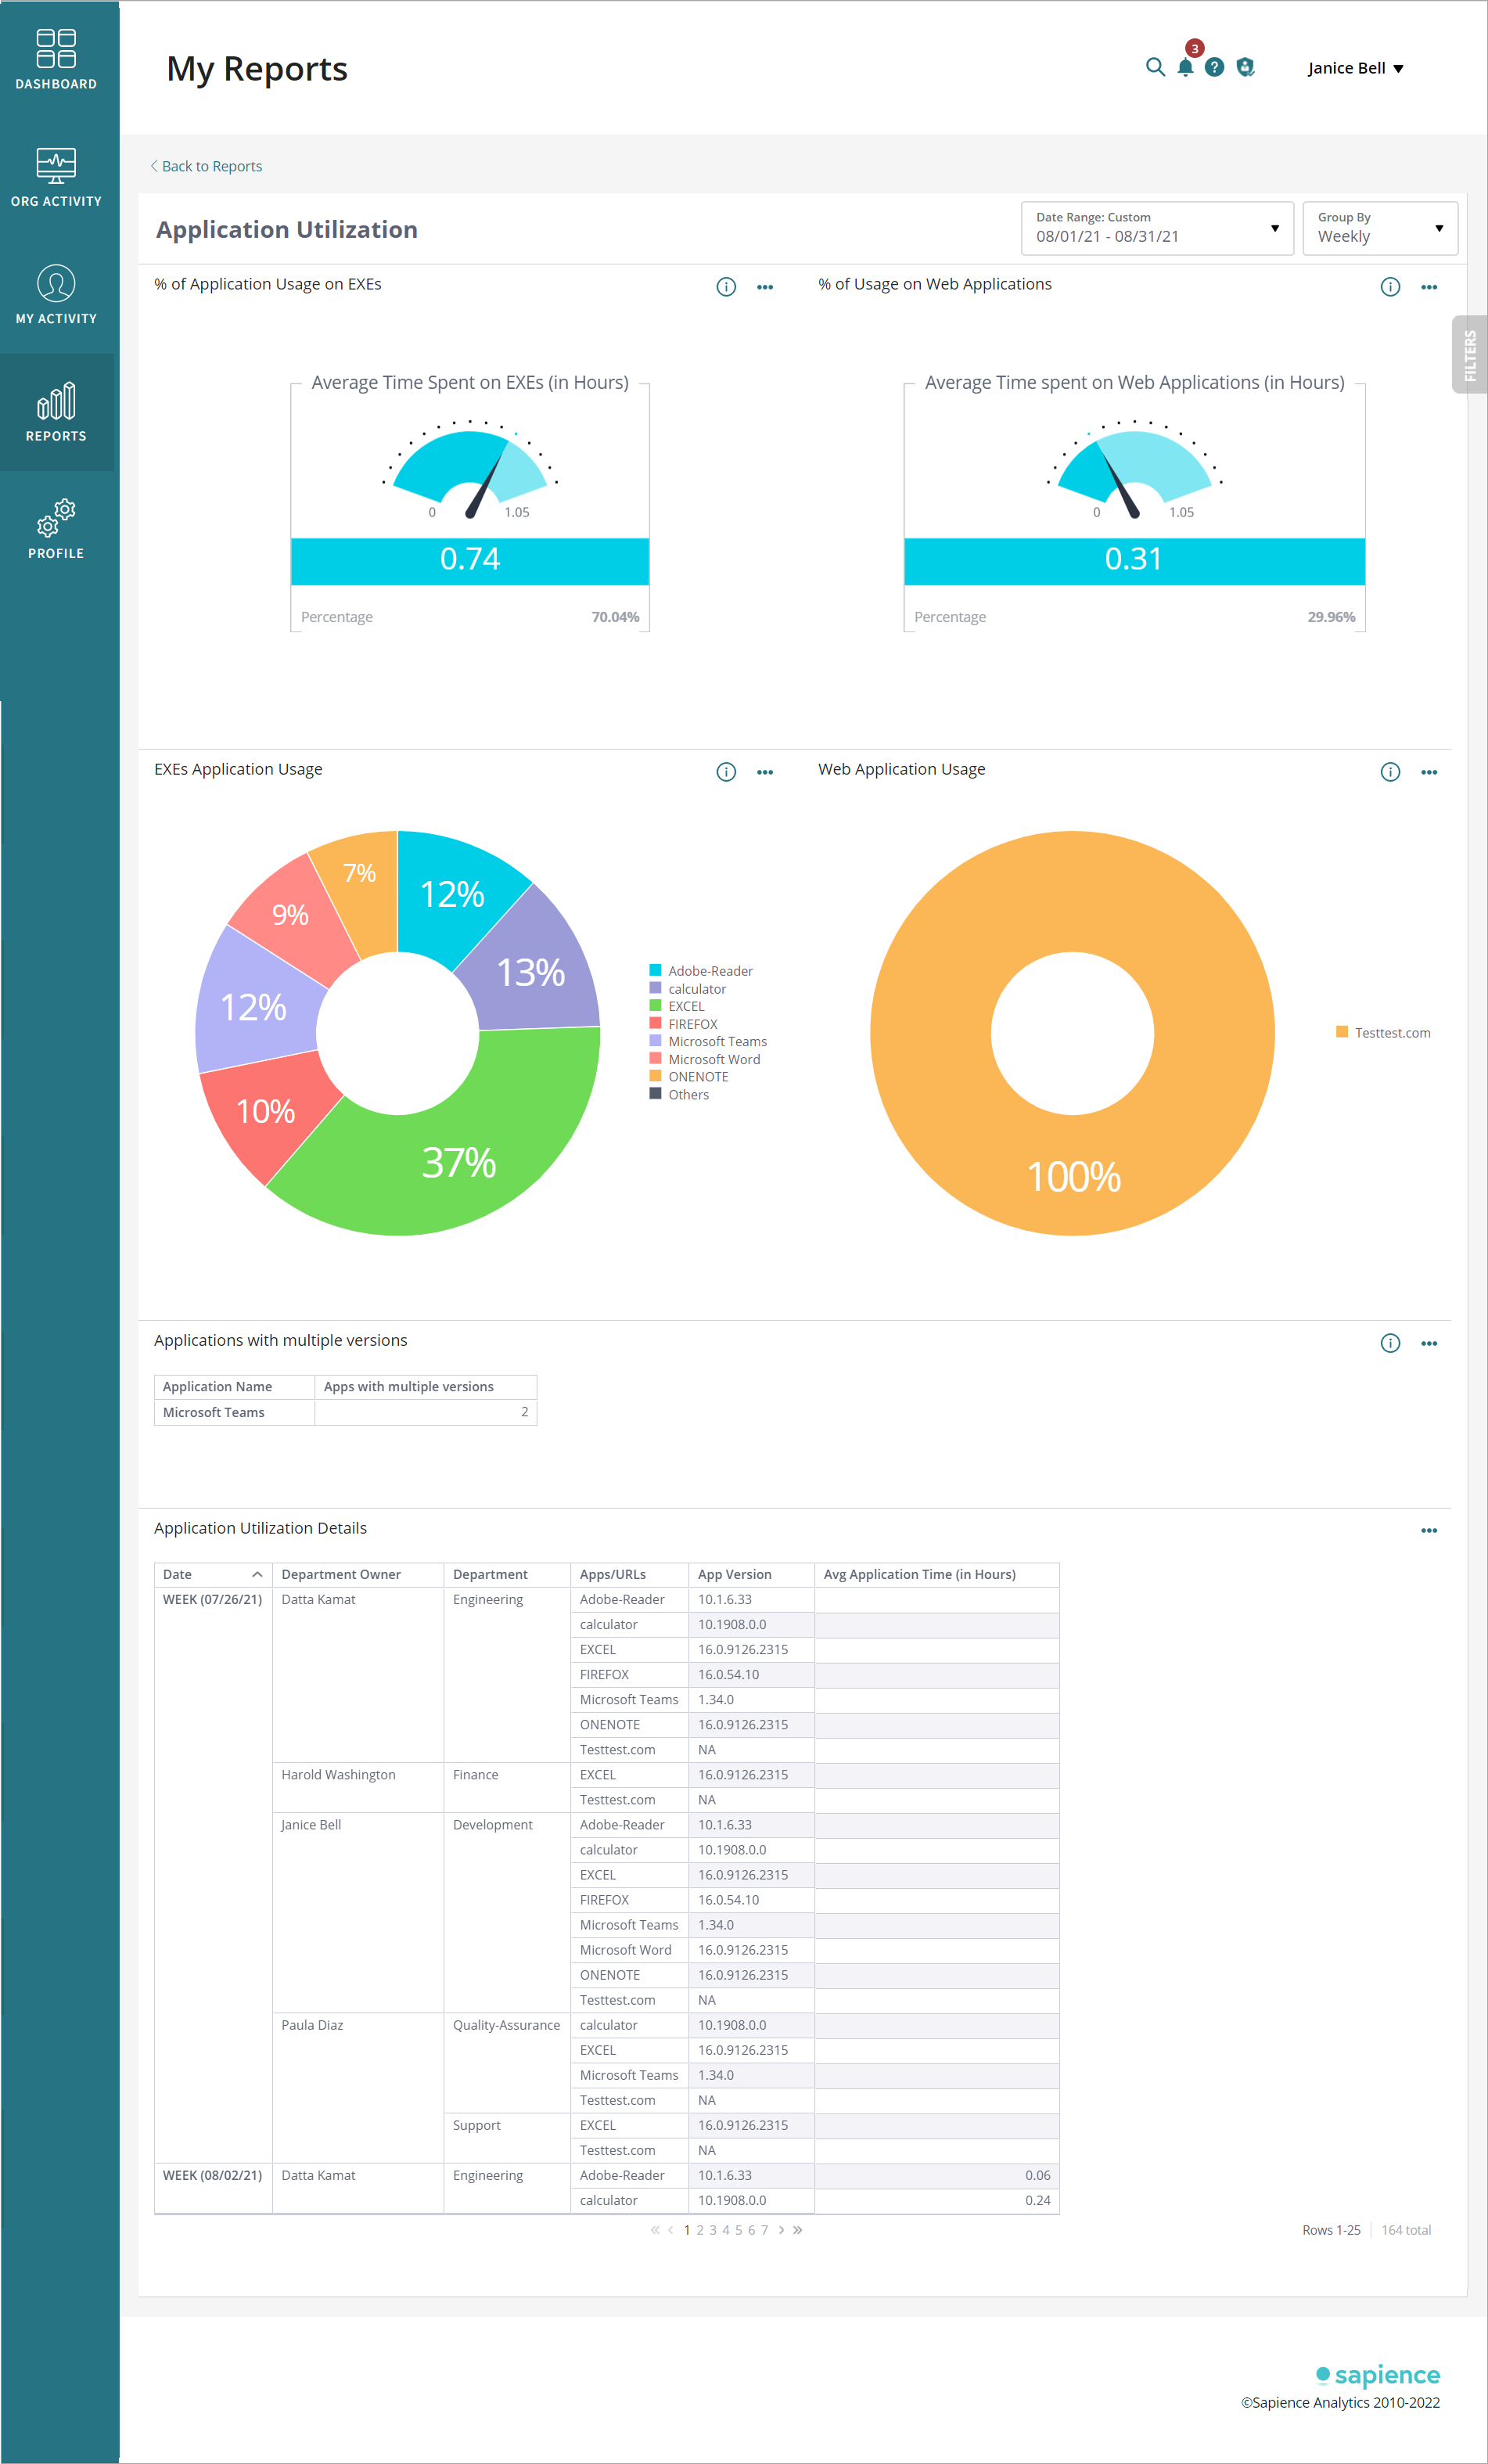
Application Utilization
This report lists the applications utilized along with the duration details.
Note: Report available only for Departments Owners.
Available Filters:
•Date Range
•Group By
•Department Owner
•Department
•Applications / URLs
In the report:
•% of Application Usage on EXEs: Average and % of Time spent on usage of EXE applications out of all the other applications used by the department identified by the filter for the selected date range.
•% of Usage on Web Applications: Average and % of Time spent on usage of Web applications out of all the other applications used by the department identified by the filter for the selected date range.
•EXEs Application Usage: Chart displays the % usage for EXE applications used by the department identified by the filter for the selected date range.
•Web Application Usage: Chart displays the % usage for Web applications used by the department identified by the filter for the selected date range.
•Applications with multiple versions: Table displays the list of applications that have multiple versions.
•Application Utilization Details: Table displays the date-wise user list with applications details and the average time spent (in hours) on those applications.