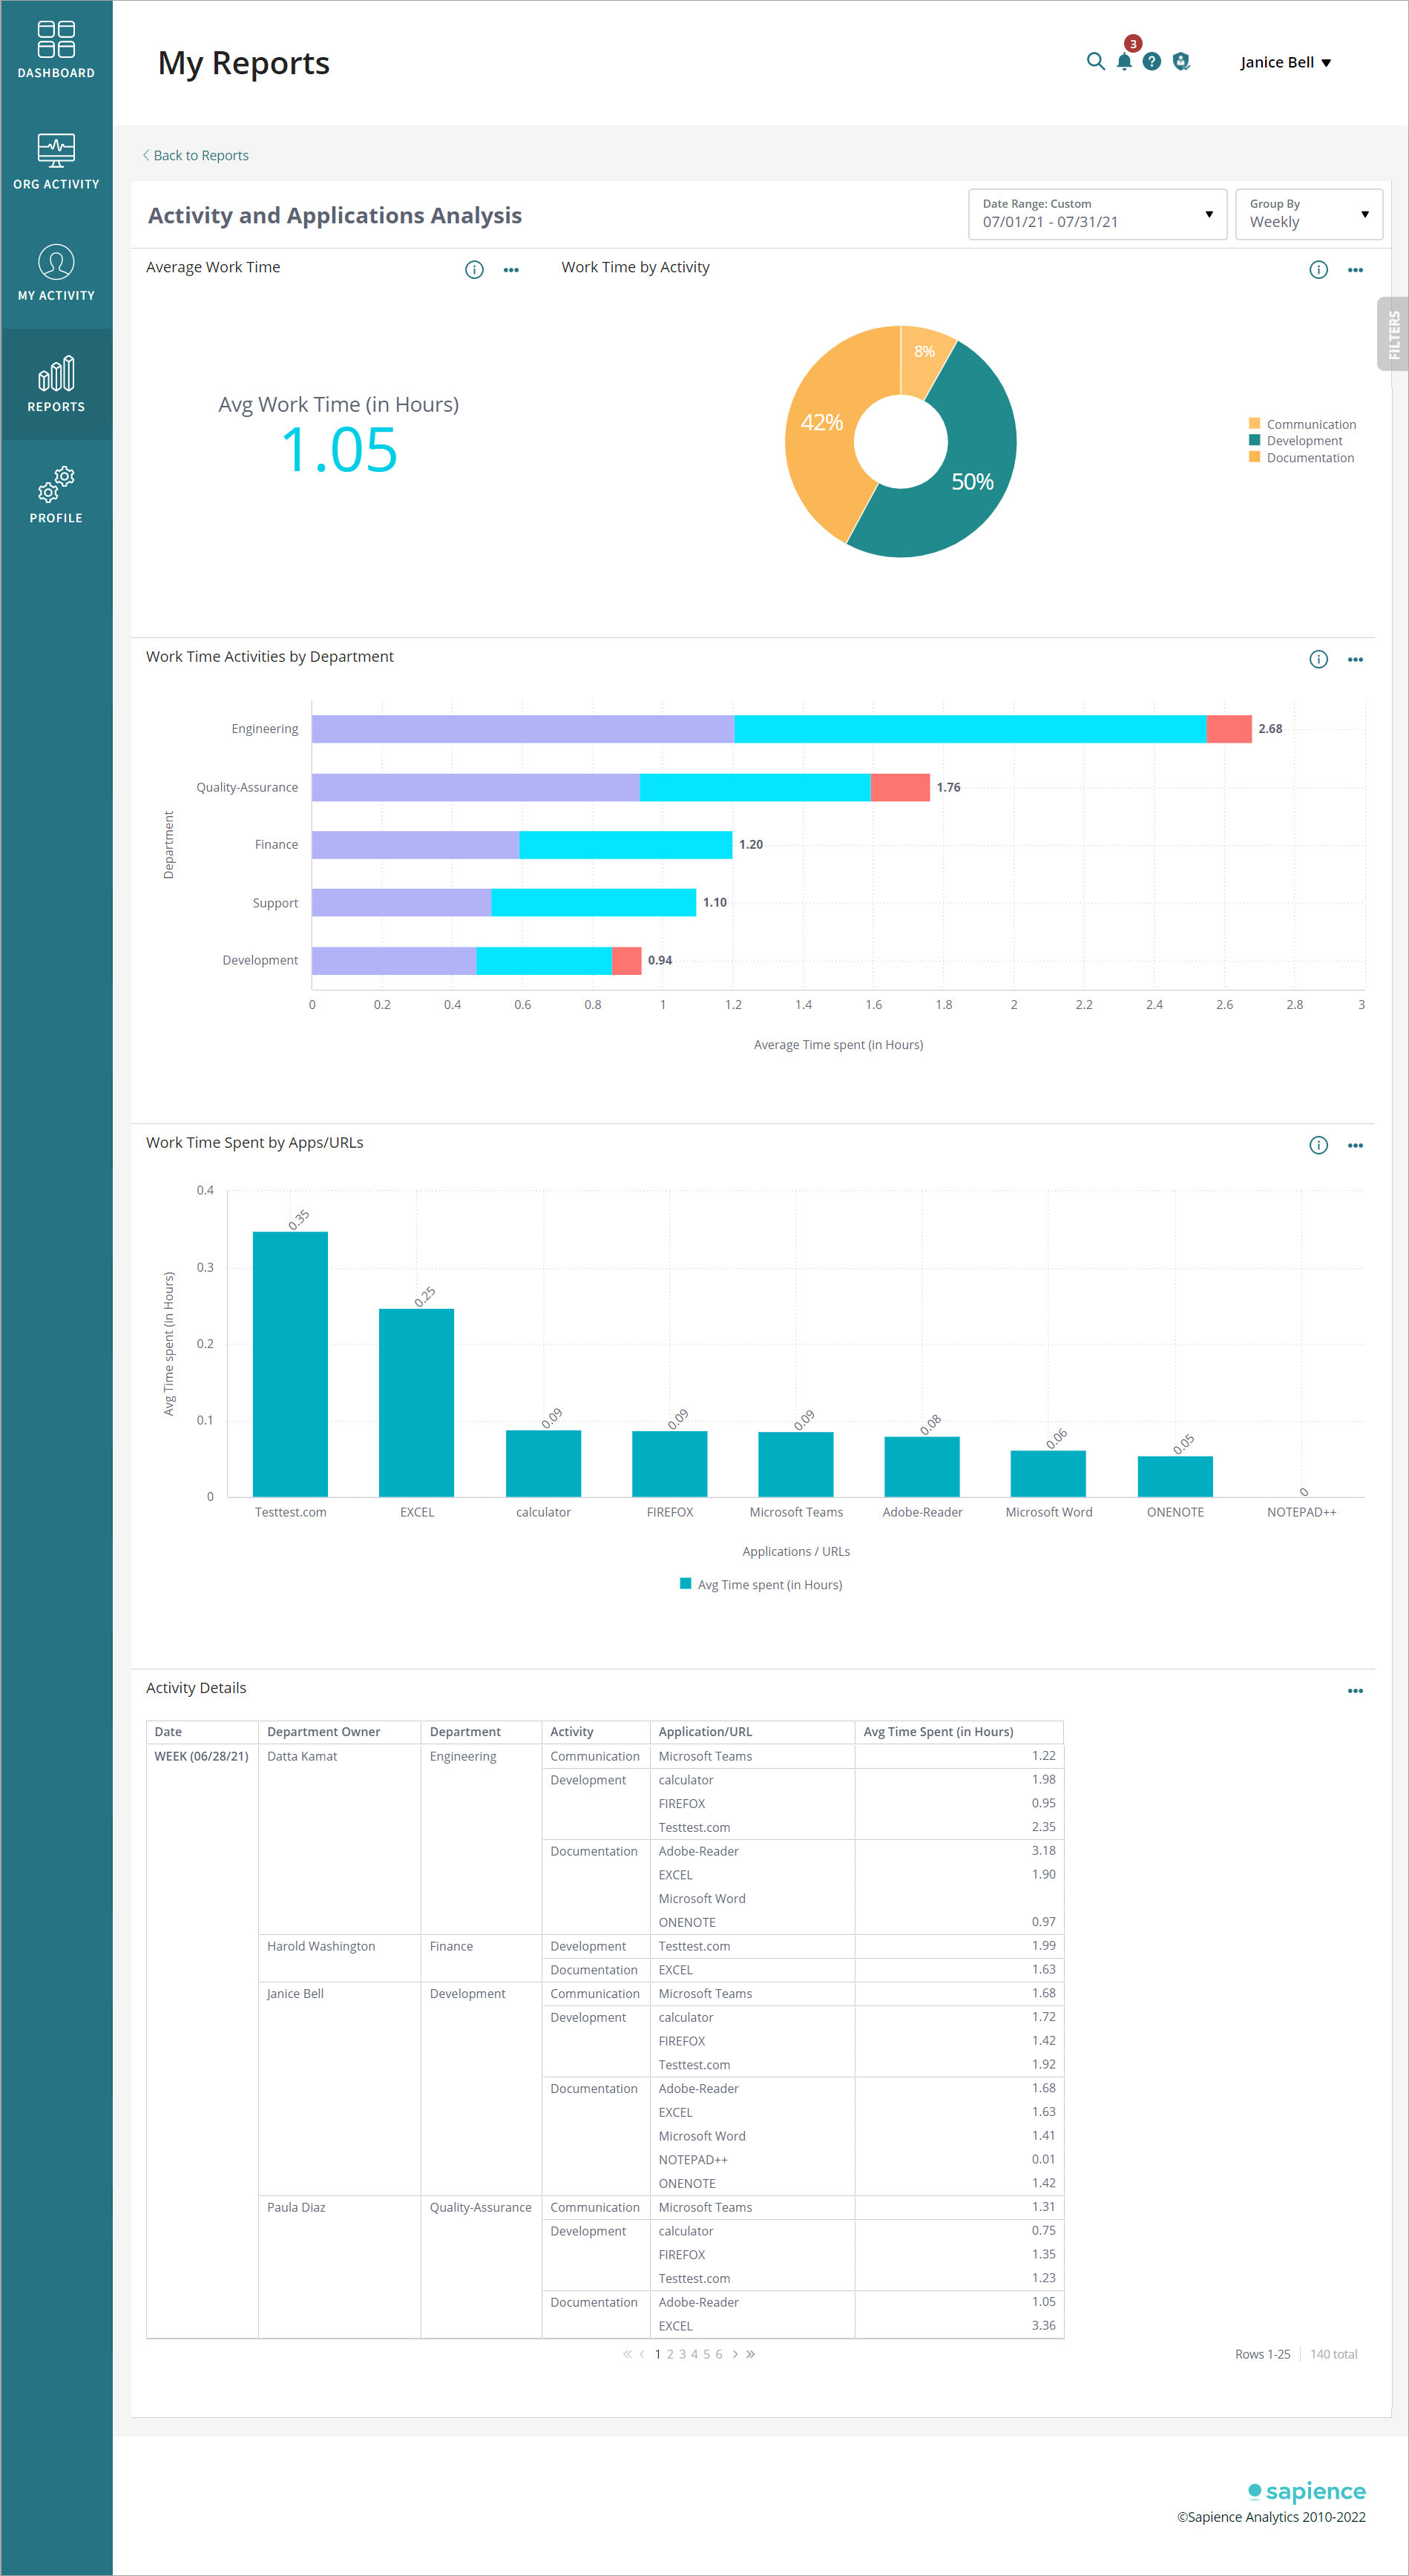
Activity and Application Analysis
This report displays the department-wise activity details for the departments identified by the filter for the selected date range.
Note: Report available only for Department owners.
Available Filters:
•Date Range
•Group By
•Department
•Department Owners
•Activity
•Application / URL
In the report:
•Average Work Time: Average work time (in hours) for the departments identified by the filter for the selected date range.
•Work Time by Activity: Chart displays the ratio of Activity-wise time spent during Work Time on Activities that are marked as Work.
•Work Time Activities by Department: Chart displays the stack of Activity-wise time spent for every department that is identified by the filter.
•Work Time spent by Apps / URLs: Chart displays the App / URL wise time spent for activities that are identified by the filter.
•Activity Details: Table with department-wise activity and application details.