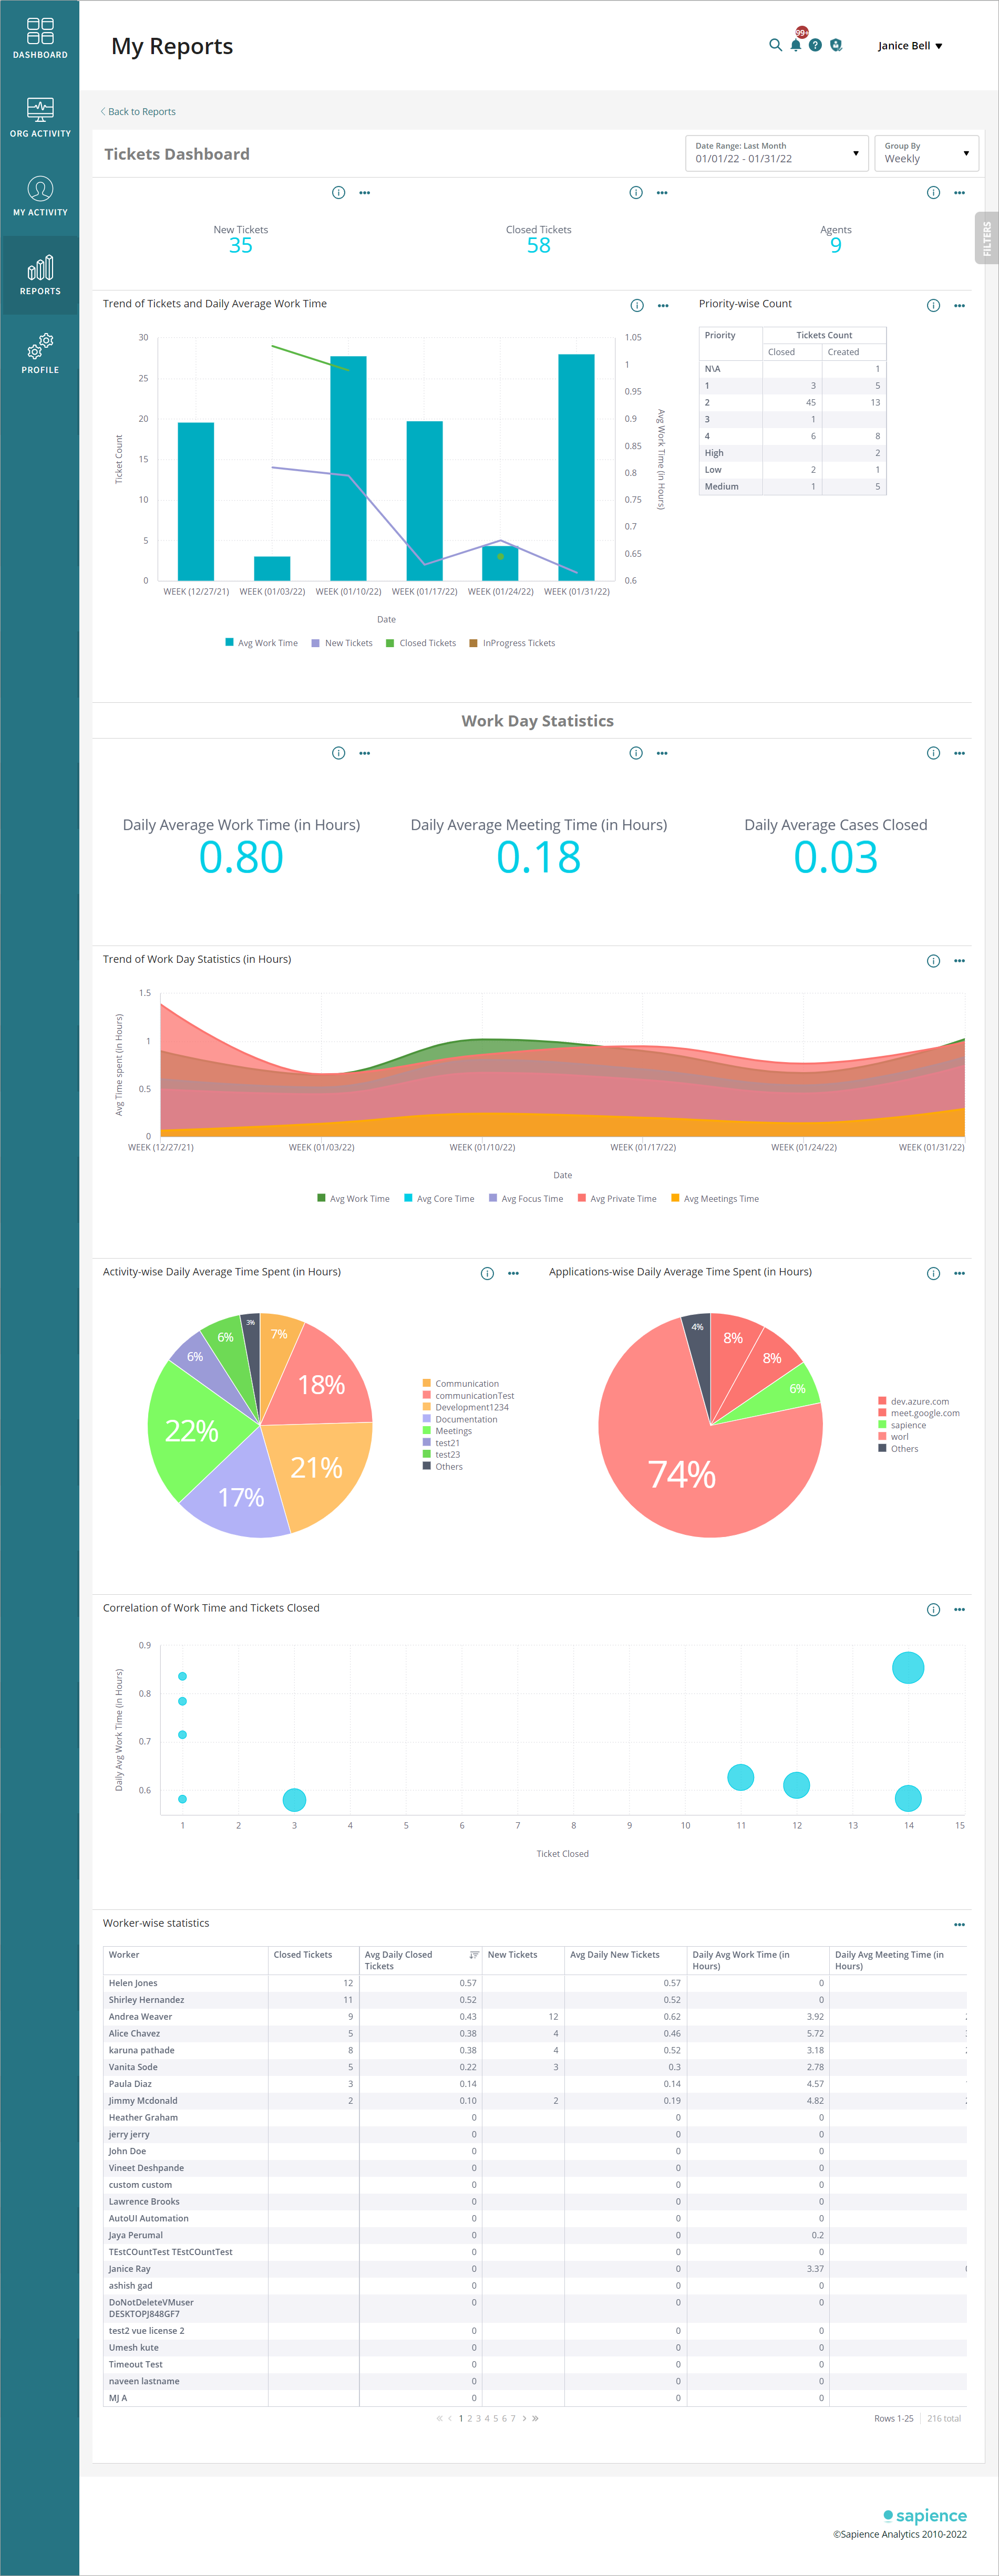
Tickets Dashboard
This report displays agent-related ticket statistics and their work day statistics.
Note: Report display data only:
•If the organization has subscribed and activated integration with ticketing system(s) offered by Sapience.
•For Registered Sapience Workers whose Activity Collection is ON.
Available Filters:
•Date Range
•Data Source (Select the data source to view ticket related data from that source(s). By default, all the sources are selected.) Available Data Sources are:
•Salesforce Cases
•Azure DevOps
•Ticket Type (Select the ticket type to view ticket related data from that source(s))
•Salesforce Cases: Cases
•Azure DevOps: Available work items defined in organization's Azure DevOps instance.
•Location
•Job Family
•Department
•Manager
•Worker
In the report:
•Count of New Tickets, Closed Tickets, and unique Agents identified by the filter for the selected date range.
•Trend of Tickets and Daily Average Work Time: Chart displays the day-wise trend of Daily Average Work Time, New Tickets, In Progress Tickets, and Close Tickets.
•Priority-wise Count: Table of Priority-wise count of Closed and Created Tickets.
•Work Day Statistics for Daily Averages hours of Work Time, Meeting Time, and Daily Average Cases Closed rate.
•Trend of Work Day Statistics (Hrs): Date-wise trend of average hours for Work Time, Core Time, Focus Time, Private Time, and Meeting Time.
•Activity-wise Daily Average Time Spent (Hrs): Chart shows activity-wise daily average time spent by the workers identified by the filter.
•Applications-wise Daily Average Time Spent (Hrs): Chart shows application-wise daily average time spent by the workers identified by the filter.
•Correlation of Work Time and Tickets Closed: The bubble chart shows the correlation between work time and the number of tickets closed per day. A bubble represents a day and the bubble size is based on the number of unique workers on that day.
•Worker-wise statistics: Table with worker-wise statistics of Tickets and daily work day averages.